
Two clusters, one view, and the label that decides whether it works

Ask how a fleet view gets built and the answer arrives quickly. Run Prometheus everywhere, point every instance at one central store, done. Metrics flow in, Grafana reads from one place, and nobody has to remember which cluster owns which dashboard.
Then someone opens the central view and asks which cluster's kubelet just went down. The series is right there, up{job="kubelet"} == 0, and it cannot answer. Every cluster's kubelet job carries the same labels: same job name, same namespace, same service. The same series arrives from every cluster, and the hub has no idea which is which. Collapsing every cluster into one datastore did not create a fleet view; it destroyed the one piece of information a fleet view needs.
So invert it. The design is not "send everything to one place". It is "make sure every series knows where it came from before it leaves". The datastore is a mailroom, and a letter with no return address is exactly as useful as no letter at all.
Frank the hub's own post as well
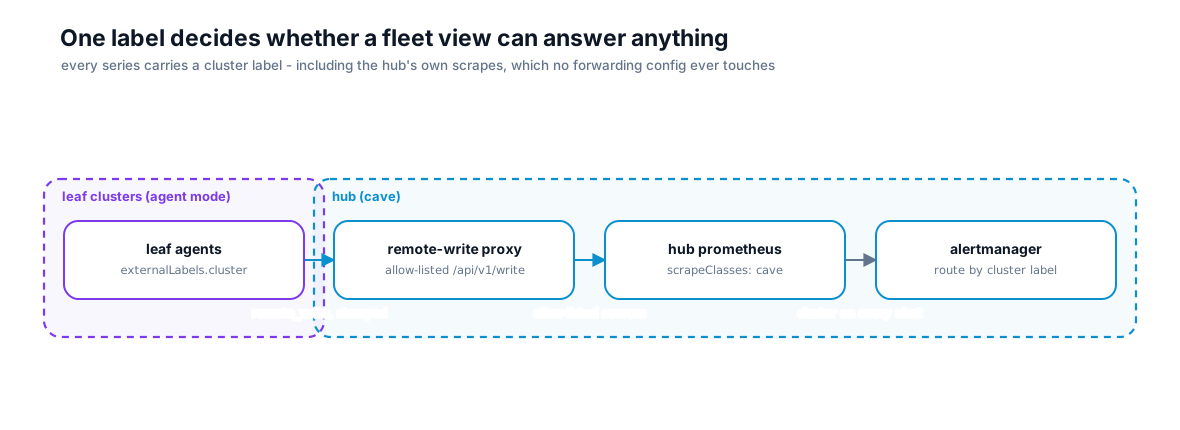
The mechanism on the leaf clusters is small. Each runs Prometheus in agent mode, a scrape-and-forward configuration with no local query engine and a write-ahead log on an emptyDir instead of a disk full of blocks, and every sample it forwards carries a cluster name stamped by externalLabels. The hub's write receiver is one flag, and it sits behind a source-restricted proxy so only the leaf addresses on an allow-list can post. A leaf that goes dark simply stops posting; a leaf that lies about its name would have to get past the proxy first.
That much most people get right. The hub's own targets are where it went wrong for me. The hub scrapes those too, and those samples never pass through any forwarding config. There is no remote write, so there is no stamp. The result was a central Prometheus where every leaf series carried a cluster label and the hub's own eighteen targets carried none. Every fleet dashboard had a blank bucket, and up{cluster="cave"} returned nothing for the one cluster hosting the dashboard.
The fix is to frank the hub's own post at the counter, with a default scrape class that stamps the label on every target the hub scrapes locally:
prometheus:
  prometheusSpec:
    externalLabels:
      cluster: cave
    scrapeClasses:
      - name: cluster-stamp
        default: true
        relabelings:
          - targetLabel: cluster
            replacement: cave
            action: replace
# externalLabels covers what LEAVES the hub; the scrape class covers what the hub keeps for itself
externalLabels alone does not do it, because external labels are attached when samples leave, to alerts and to remote writes, not to what the hub stores for its own queries. The scrape class stamps the sample at ingestion, which is the only place the hub's own series ever pass through. And the proof is a single query against the hub, which should return one bucket per cluster and nothing nameless:
kubectl get --raw \
  "/api/v1/namespaces/monitoring/services/kube-prometheus-stack-prometheus:9090/proxy/api/v1/query?query=count%20by%20(cluster)%20(up)" \
  | jq -c '.data.result[] | {cluster: .metric.cluster, targets: .value[1]}'
# {"cluster":"cave","targets":"18"} {"cluster":"alfred","targets":"4"} {"cluster":"elfastc","targets":"6"} - no nameless row means every scrape carries its origin
The hub and two leaves, because only two of the five leaves were powered on the night I ran it; the rest are on-demand nodes, and a leaf that is off posts nothing. Before the scrape class landed, the biggest bucket in that output had no cluster at all.
Mute what the topology made impossible
The second surprise arrives as pages, and the pages are correct.
PrometheusNotConnectedToAlertmanagers fires for every leaf, permanently. An agent has no alerting engine and no Alertmanager to connect to, so it reports zero discovered Alertmanagers, which is true, and forwards that fact to the hub, where the rule reads it. KubeletDown fires for every leaf too, for a subtler reason: the rule is already cluster-aware. It counts nodes per cluster from kube_node_info, which the leaves forward, and expects a healthy kubelet scrape per cluster, which the leaves deliberately do not. A leaf that knows about its node and says nothing about its kubelet looks exactly like a cluster whose kubelet died. Both alerts are doing precisely what they were written to do. The topology just made their premise impossible.
Deleting the rules is the wrong fix, because they are load-bearing on the hub. Route them to nowhere instead, when they come from a cluster whose topology makes them meaningless. Now that every alert carries the cluster label, that routing is a matcher rather than a hack:
alertmanager:
  config:
    route:
      group_by: ['alertname', 'cluster']
      routes:
        - receiver: 'null'
          matchers:
            - alertname = "Watchdog"
        - receiver: 'null'
          matchers:
            - alertname =~ "KubeletDown|PrometheusNotConnectedToAlertmanagers|InfoInhibitor"
            - cluster =~ "alfred|robin|wgirl|kate|elfastc"
# the hub's own KubeletDown still pages; only the leaf-mode false positives are routed to the null receiver
That second rule lists the leaves by name. The cleaner alternative is a naming convention, so a new leaf inherits the mute on its first push. I have not made that move, because a mute that applies to a cluster nobody has looked at yet is a mute nobody chose. The list costs a night of meaningless pages for each new cluster and buys a forced look at its agent config; a convention buys the reverse. Pick one knowingly. The failure is a route nobody remembers exists.
Write down what you dropped
The filter on each leaf is the decision nobody writes down.
Forwarding everything from every cluster is expensive in the exact currency a hub is short on: series cardinality. So the leaves filter. Kube-state-metrics on a leaf forwards node conditions and workload replica counts, and drops the long tail of per-container-per-label detail that is only worth having locally. The hub holds the fleet-level truth, at a fraction of the ingest.
That filtering decides what the hub can never answer, and a choice made at the leaf, in a values file, is the kind that leaks. Months later someone writes a hub alert on a series the leaf never sends, and the alert never fires, which looks exactly like nothing being wrong. I have already written about a rule that watched for a series the filter had dropped before it left; the fix there was a meta-alert on the metric's absence. The fix here is upstream of that. The allow-list is a versioned artefact next to the leaf config, not a fact somebody remembers:
kube-state-metrics:
  metricAllowlist:
    - kube_node_status_condition
    - kube_node_info
    - kube_deployment_spec_replicas
    - kube_deployment_status_replicas_available
    - kube_statefulset_replicas
    - kube_statefulset_status_replicas_ready
    - kube_daemonset_status_desired_number_scheduled
    - kube_daemonset_status_number_available
    - kube_pod_container_status_restarts_total
    - kube_cronjob_status_last_successful_time
# anything not on this list never leaves the leaf: a hub alert on a dropped family is silent forever, not failing
Every time a hub alert references a series, the author checks the list before trusting the rule. Ten families in, everything else stays home. What was dropped and why is as much a part of the design as what was kept.
The principle
A fleet view lives or dies on one label. The muted routes and the allow-list are both consequences of every series knowing where it came from, and the only place that knowledge can be attached is at the source, before the series leaves home. Anything stamped later is a guess wearing a label.
Stamp everything, including the post you never send.
In the lab: leaf clusters in agent mode writing to one hub through an allow-listed proxy, a default scrape class franking the hub's own eighteen targets, and one count by (cluster) query that finally returns no nameless row.